Caesarean Section Rates Versus Stillbirth Rates Critical care Obstetrics
Yves Muscat Baron
Yves Muscat Baron*
Department of Obstetrics and Gynaecology, Mater Dei Hospital, Malta
- Corresponding Author:
- Yves Muscat Baron
Department of Obstetrics and Gynaecology
Mater Dei Hospital, Malta
E-mail: yambaron@go.net.mt
Received Date: February 12, 2016, Accepted Date: February 18, 2016, Published Date: February 25, 2016
Citation: Baron YM. Caesarean Section Rates Versus Stillbirth Rates Critical care Obstetrics. Crit Care Obst&Gyne. 2016, 2:1. doi: 10.21767/2471-9803.100014
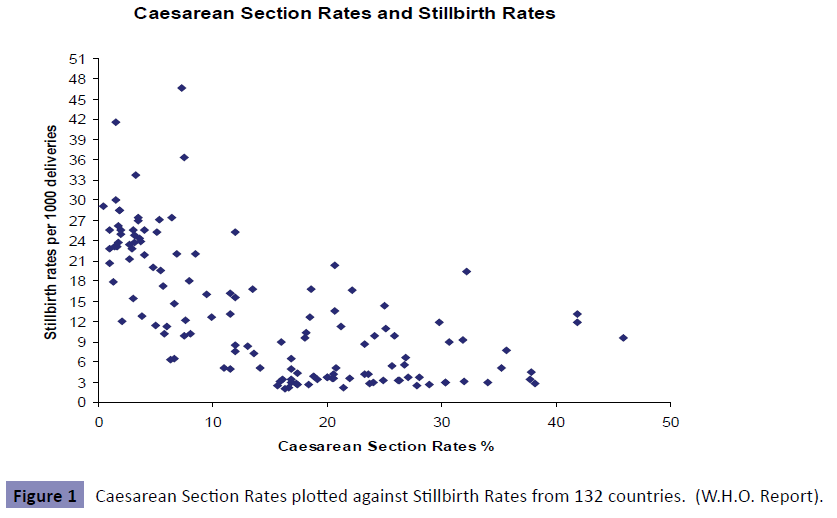
Caesarean Section Rates plotted against Stillbirth Rates from 132 countries. (W.H.O. Report).
From data obtained from the World Health Organization, the pattern of Stillbirth Rates versus Caesarean Section Rates indicate a trimodal pattern broadly divided into three groups.
The three groups can be differentiated from the varying stillbirth rates in various countries (data available for both Stillbirths rates and Caesarean Section rates in 132 countries):
Group A Stillbirth rates of 2 - 4/1000 live births,
Group B Stillbirth rates of 4.1 - 12/1000 live births and
Group C Stillbirth rates of 12.1 - over 30 stillbirths /1000.
The maximum stillbirth rate recorded was 46.7/1000 in Pakistan.
Group A (Stillbirth rates of 2- 4/1000 live births) are well developed countries with adequate prenatal and neonatal care.
Group B are countries that have Caesarean Section rates above 15% but have stillbirth rates of 4.1 - 12/100 live births possibly due deficencies in healthcare systems including neonatal care.
Group C (Stillbirth rates of 12.1 - over 30 stillbirths /1000) are in the main underdeveloped countries with Caesarean Section rates lower than 10% and where prenatal care may also be deficient.
None of the countries with stillbirth rates of 2- 4 /1000 have a Caesarean Section rate between the World Health Organization recommended 10-15% thresholds.
Open Access Journals
- Aquaculture & Veterinary Science
- Chemistry & Chemical Sciences
- Clinical Sciences
- Engineering
- General Science
- Genetics & Molecular Biology
- Health Care & Nursing
- Immunology & Microbiology
- Materials Science
- Mathematics & Physics
- Medical Sciences
- Neurology & Psychiatry
- Oncology & Cancer Science
- Pharmaceutical Sciences

